
Recession Could Be Months Away and Stock Market Top Could Be Nearing
Investors beware, the U.S. economy could be just months away from a recession. Mark these words; if a slowdown actually becomes reality, we could be approaching a top on the stock market sooner than later and a sell-off could be ahead.
It’s very understandable; the idea of a recession may sound like an out-of-this-world idea when the headline economic data suggests that everything is fine. But investors have to remember one thing; the economic data we see is usually lagging.
Advertisement

For example, the gross domestic product (GDP) you see tells us what happened in the last quarter, not what’s ahead in the next quarter. Mind you, this number is also revised several times, so you don’t really know the entire story until several months later.
One Chart Foretells That a Recession Is Coming
There’s one indicator that can tell us where the U.S. economy is headed next. It’s the yield on bonds.
Please look at the chart below and look closely at the gray areas.
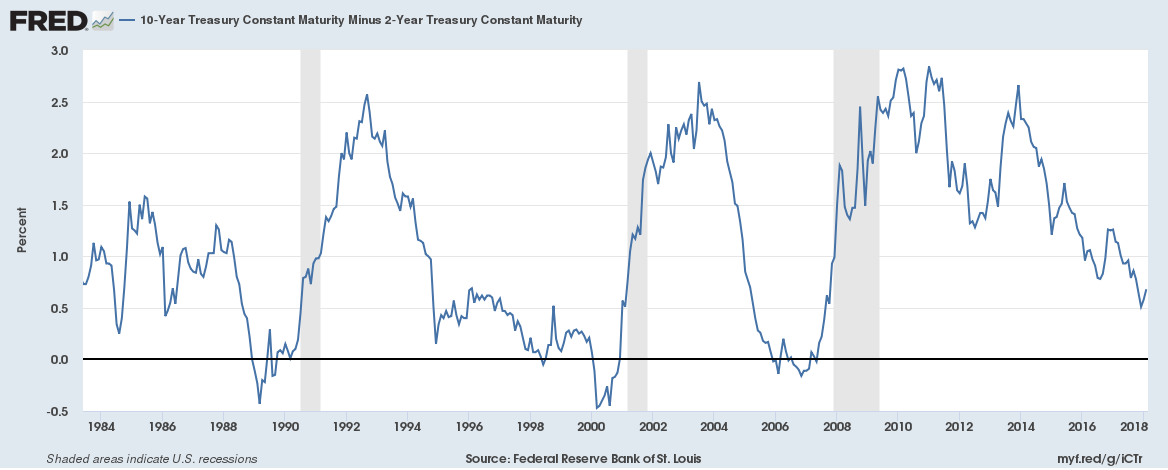
(Source: “10-Year Treasury Constant Maturity Minus 2-Year Treasury Constant Maturity,” Federal Reserve Bank of St. Louis, last accessed February 23, 2018.)
At its core, the chart above shows the difference between the yields on 10-year U.S. bonds and two-year U.S. bonds. It’s something very powerful and it has been a great tool in providing an idea of where the U.S. economy could go.
On the chart above, gray areas represent recession in the U.S. economy.
Notice something interesting?
Just before the U.S. economy is about to enter into an economic slowdown, the difference in yields of these two bonds comes awfully close to or drops below zero.
As it stands, we are not too far away from the “danger” level. The difference in yields of 10-year U.S. bonds and two-year U.S. bonds is at the lowest level since October 2007 and inching closer to zero very quickly.
Keep in mind, this simple chart has predicted the last three recessions.
In 1990, it dropped below zero. A recession followed a few months later. Then, in 2000, it dropped below zero. A recession followed a few months later. Finally, in 2007, the difference in yields of 10-year U.S. bonds and two-year U.S. bonds fell below zero and a recession followed a few months later.
What Does All This Have to Do with the Stock Market?
Dear reader, often, it is forgotten that stock market tops are usually formed before the economy actually enters into a recession. Need an example? The Dow Jones Industrial Average (DJIA) formed a top in October 2007. At that time, the data wasn’t showing an economic slowdown and a lot of stock advisors were calling for much higher stock market prices.
If the chart above is correct, we could be nearing a stock market top sooner than later. And, a sell-off could be nearing, too.
With all this in mind, it’s important for investors to think about capital preservation. If there’s a sell-off, it could wipe off a lot of wealth.